


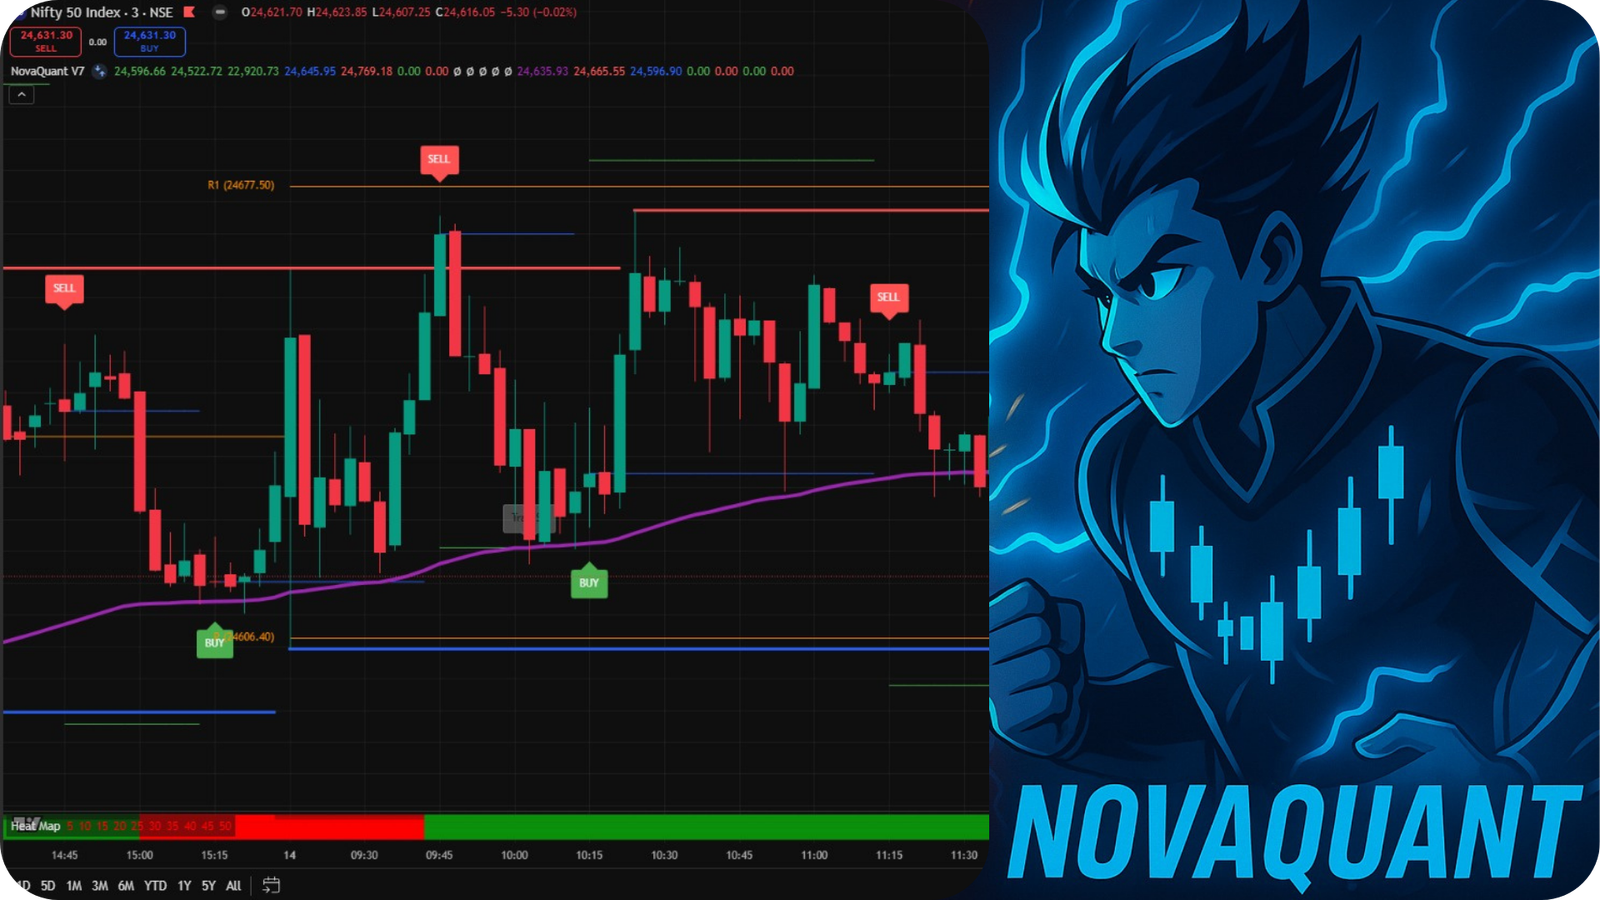
NovaQuant helps me look at charts with more clarity and structure. I often use it while analyzing BankNifty, and it supports me in spotting possible market setups with more confidence.
As someone who balances a full-time job with trading, I find that having such a visual tool saves me time and helps me stay more organized in my analysis.

Neha Kulkarni
Executive
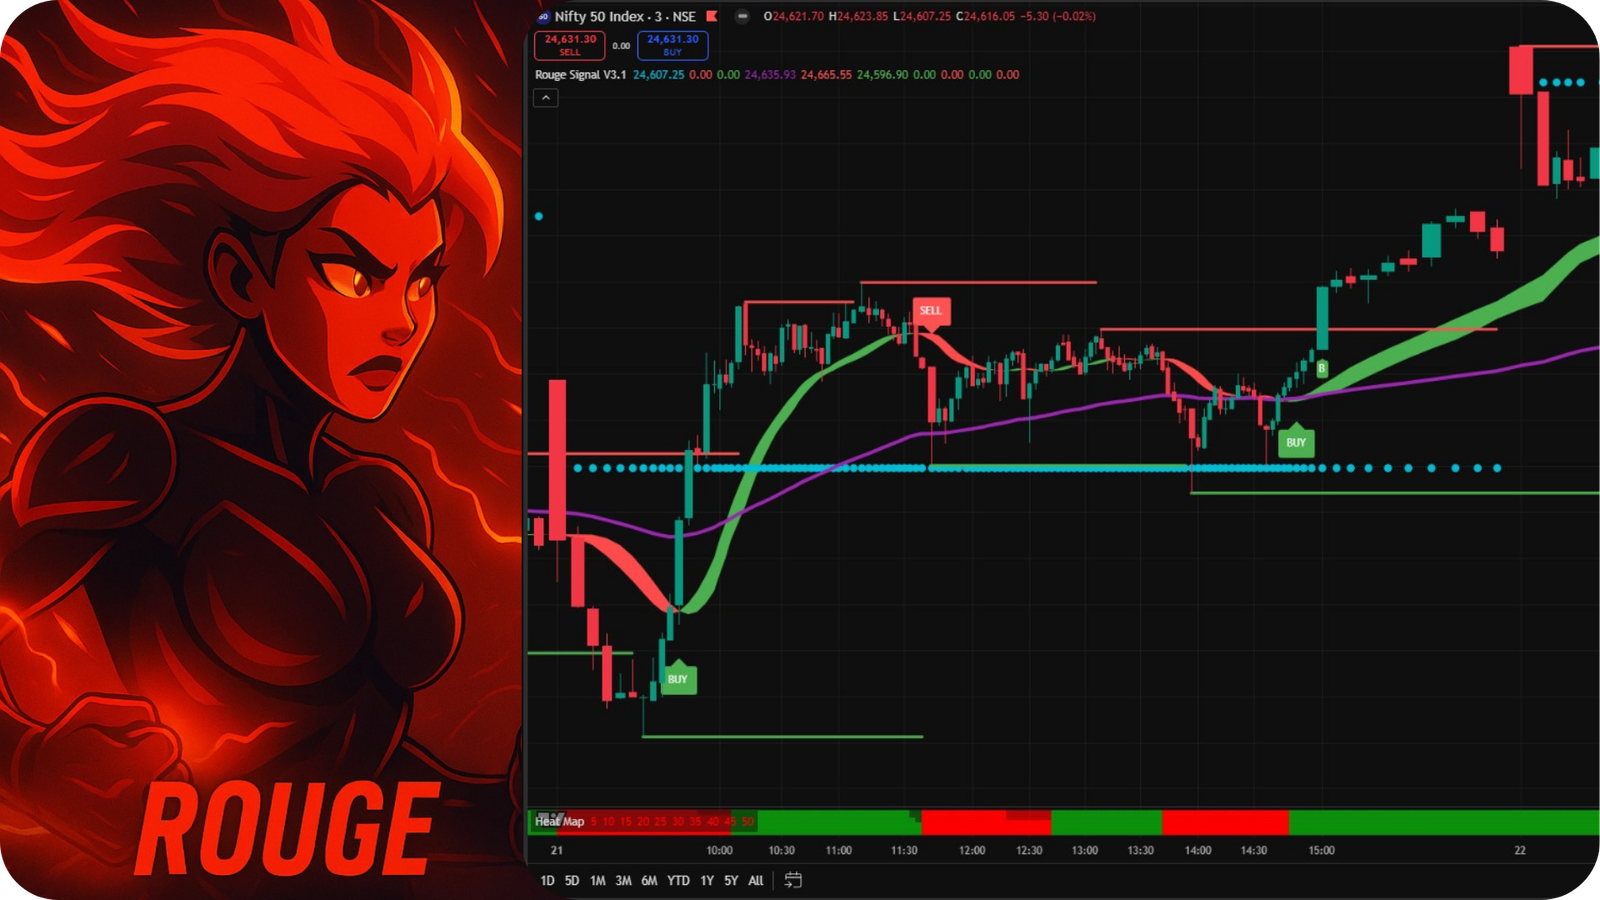
I like the way Rogue Indicator combines different charting tools, such as the heatmap and EMA line, into one view. It makes my charts easier to read and my analysis more structured. For me, it adds clarity when planning my strategies.

Emily G.
Equity Trader
I’ve used several charting platforms, but Nova Quant feels easier to work with. The interface is clean and simple to navigate, and it helps me organize my analysis more effectively. I find it useful for planning my trading approach with more clarity.

Angela Rutherford
Forex Trader
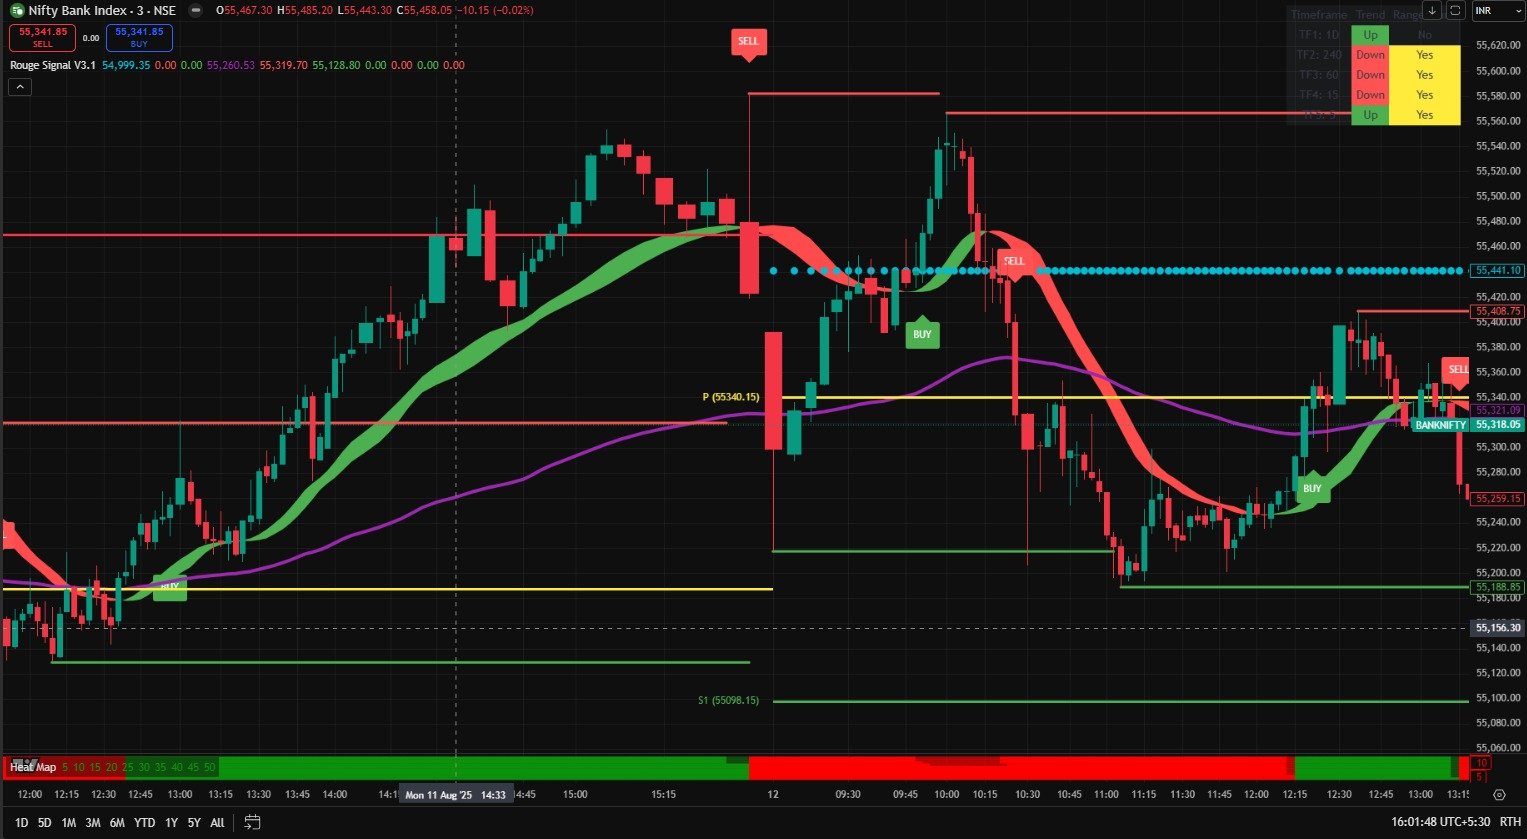
I’ve been trading for a few years and explored many indicators. What I like about Rogue is the way it highlights market momentum in a structured way. It has made my analysis process more systematic, especially during fast market moves. For me, Rogue has become a valuable charting companion.

Amit Sharma
Option Trader
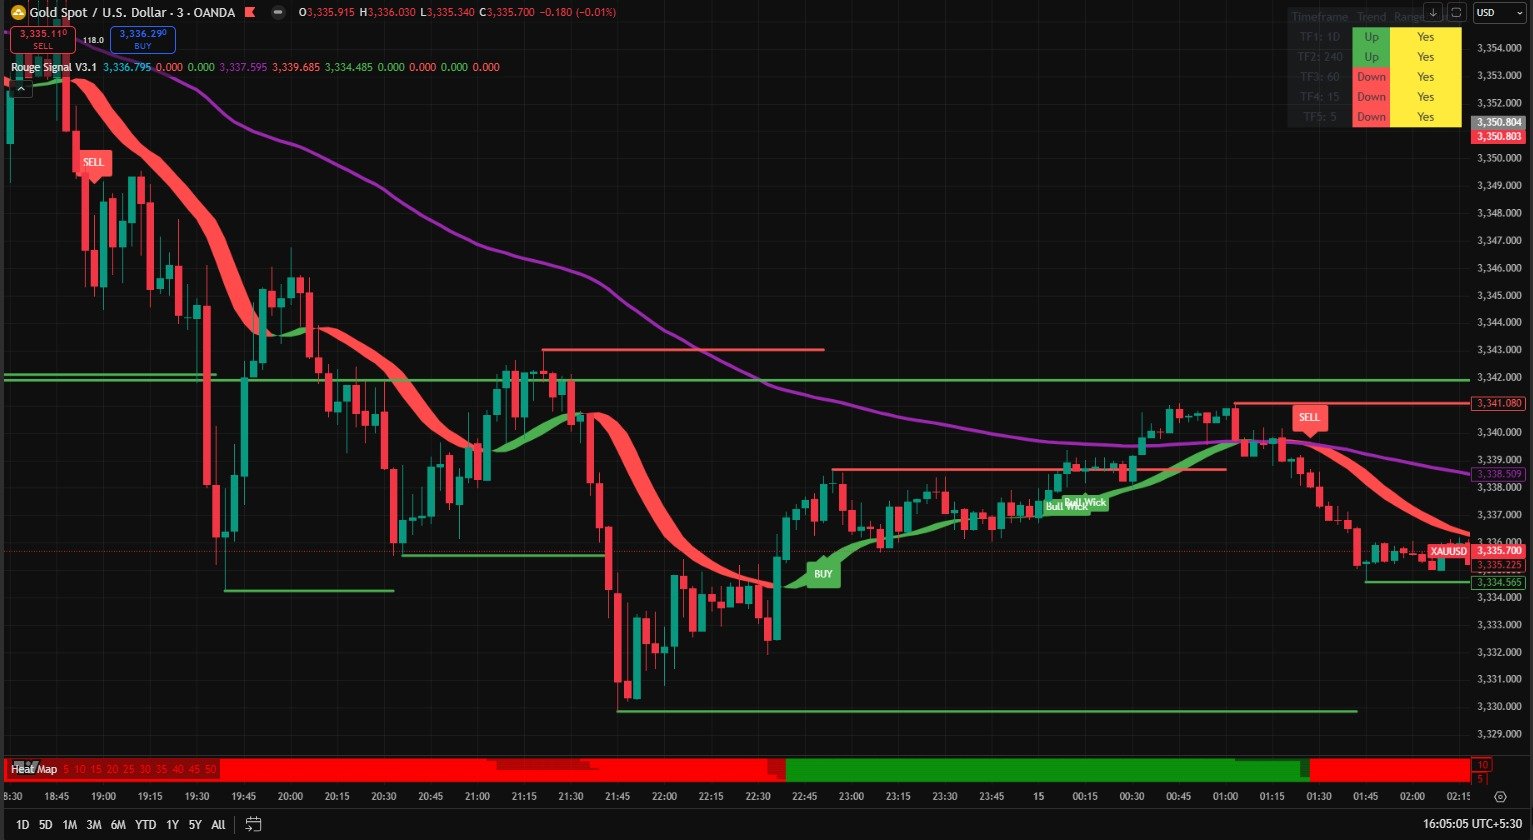
I like how Nova Quant integrates Liquidity Concepts and Order Blocks. It helps me understand price action in a more structured way, and I use it regularly when reviewing my charts. For me, it adds depth to my technical analysis.

Daniel C.
Options Trader
I started using Rogue for shorter-term chart analysis and later added Nova Quant for longer-term planning. The two complement each other well — Rogue gives me a quick view of short-term moves, while Nova helps me think about broader setups. Together, they help me stay more disciplined in my approach.

Rohit Menon
Mixed Trader